This paper is available on arxiv under CC 4.0 license.
Authors:
(1) Bartosz Kusmierz, IOTA Foundation 10405 Berlin, Germany & Department of Theoretical Physics, Wroclaw University of Science and Technology, Poland [email protected];
(2) Roman Overko, IOTA Foundation 10405 Berlin, Germany [email protected].
Table of Links
III. RESULTS
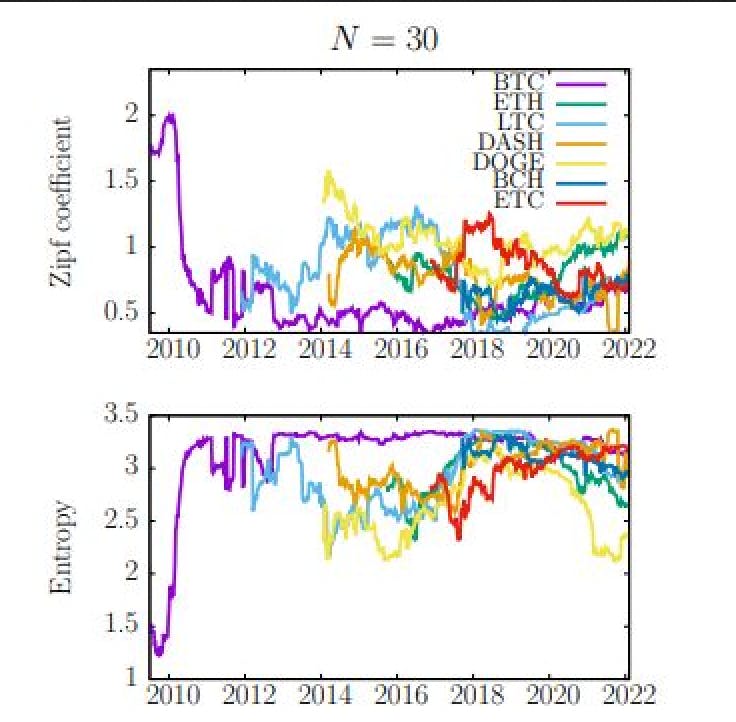
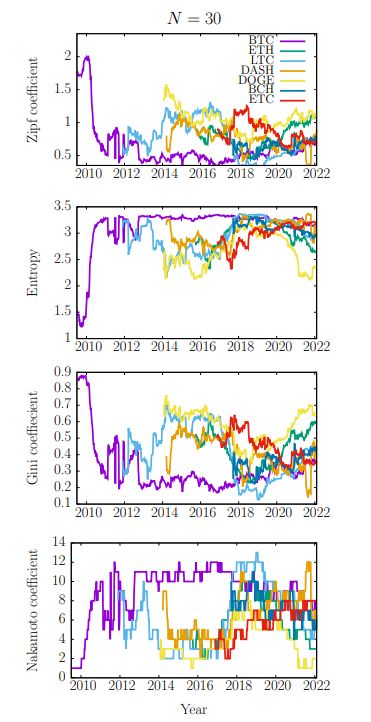
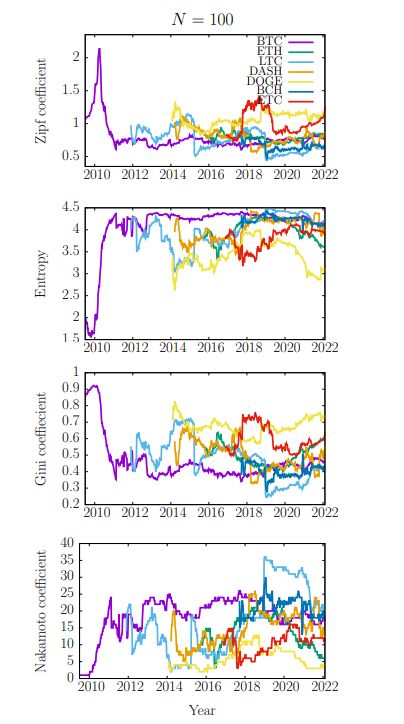
A series of plots that show the evolution of statistical metrics for the top accounts are given in Figs. 2-5. We present the data for two sample sizes N = 30 and N = 100. Cryptocurrencies are divided into two groups. The first group consists of coins, which include Bitcoin (BTC), Ethereum (ETH), Litecoin (LTC), DASH, Dogecoin (DOGE), Bitcoin Cash (BCH), and Ethereum Classic (ETC). The second group includes ERC20 tokens on the Ethereum chain: Chainlink (LINK), DAI, Uniswap (UNI), Wrapped Bitcoin (WBTC), Polygon (MATIC), Tether (USDT), and USD Coin (USDC). Note that BCH and ETC are “forks” of BTC and ETH, respectively. This means that BCH and BTC (ETC and ETH) share ledger values before the fork[6] . To avoid data duplication, we present the data for forked coins only after the split date.
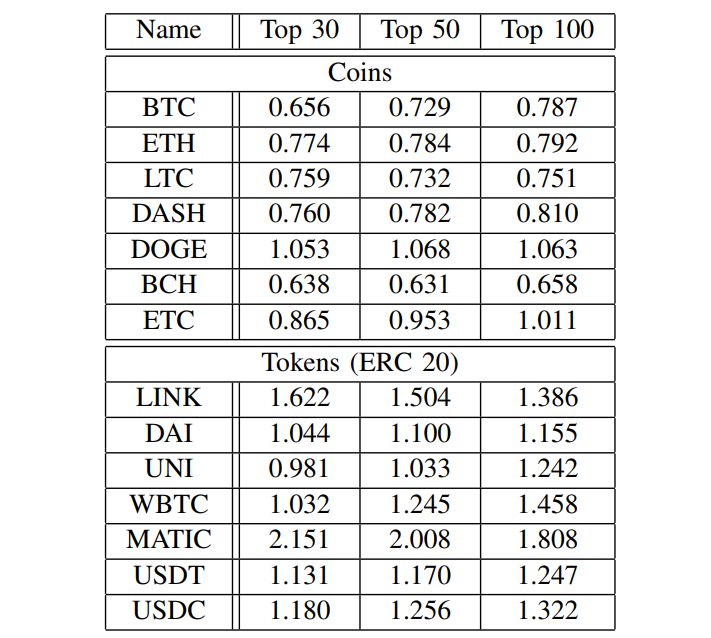
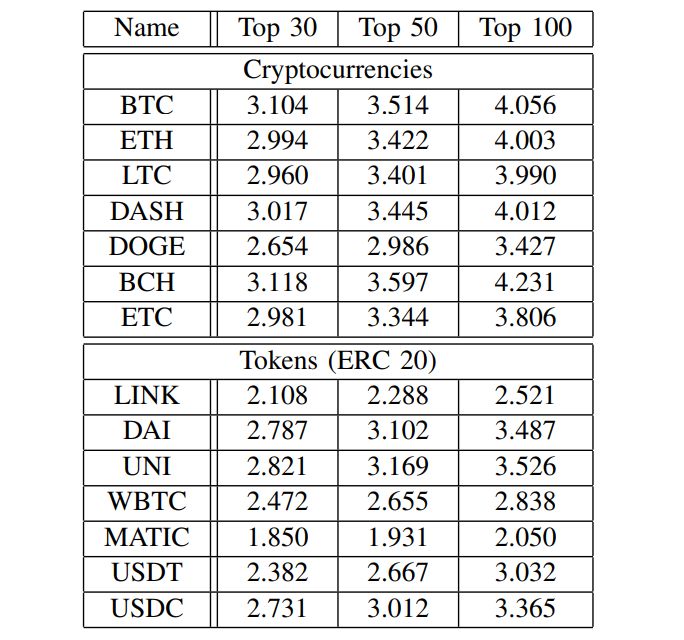
Each figure contains four subplots with (1) approximated Zipf’s law coefficient, (2) Shannon entropy, (3) Gini coefficient, and (4) Nakamoto coefficient. The Zipf’s law coefficients wereobtained using linear regression on the double logarithmic scale, while the remaining metrics are computed using definitions from Section II-D. Plots of time evolution were supplemented with the tables of average values of four analyzed quantities (see Tables I-IV).
A cursory analysis of the time-dependent data reveals that, in an initial period (just after inception), cryptocurrencies experience a volatile evolution, with rapid changes in analyzed quantities. The length of this initial period varies and can take from a couple of months to a couple of years in the case of the oldest coins. After the initial period ends, metrics evolve less dynamically, and their evolution resembles a random walk around an average value. A great example of this behavior is the data for Bitcoin. Bitcoin’s metrics show the greatest volatility in a period of approximately two years after the genesis block (see Fig. 2 and Fig. 3). Curiously, the extreme values of analyzed quantities coincide with the date of the
famous “Bitcoin pizza transaction” (May 22, 2010)[7]. The “Bitcoin pizza transaction” might be interpreted as Bitcoin leaving its “infancy”, experimental stage, and slowly being adopted as a payment method. Before May 2010, Bitcoin was rarely exchanged among users and was not used as payment for commodities.
The data for ERC20 tokens were collected for a significantly shorter time period than coins (4 years vs. 12 years). This is expected since ERC20 tokens are relatively new cryptocurrencies deployed on the Ethereum blockchain. Moreover, due to the more speculative nature, ERC20 have typically much smaller market capitalization and less active addresses than coins.
The biggest outlier in the group of ERC20 tokens is Chainlink (LINK). The Chainlink token distribution is very concentrated on the whole time interval—with the Gini coefficient around 0.8 and a surprisingly small Nakamoto coefficient of 2. This is a result of an extreme number of tokens in the
richest address dubbed “Chainlink: Node Operators” (even up to 35% of the whole token supply)[8]. Furthermore, two next richest addresses, which both belong to the team who develops the Chainlink token, have approximately 5% of the total
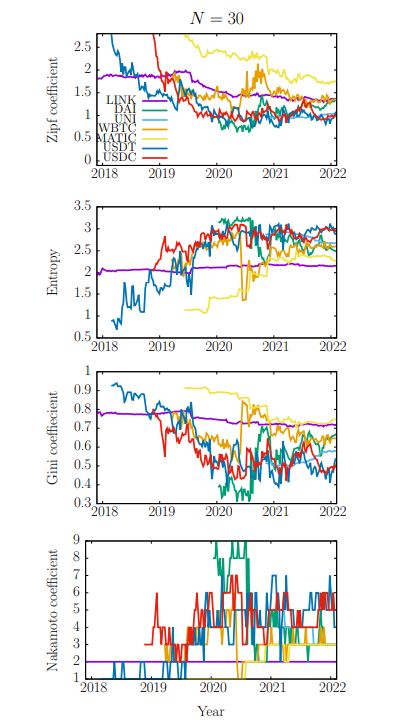
supply, which also adds to the extremely high centralization. Other tokens also experienced extremely high centralization (Tether, USD Coin), however, only Chainlink’s distribution is so concentrated on the whole analyzed interval.
Let us now focus on the main question of this paper, which is what the differences are between the statistical metrics of cryptocurrency coins and ERC20 tokens. We note that a similar, although not the same problem, was examined in [22], where the authors analyzed the market capitalization
of cryptocurrencies. The authors found that capitalization of both coins and tokens follows qualitatively the same power law. However, there are quantitative differences; namely, the estimated Zipf’s law coefficient for coins is between 0.5—0.7 and for tokens, this value is closer to 1.0—1.3
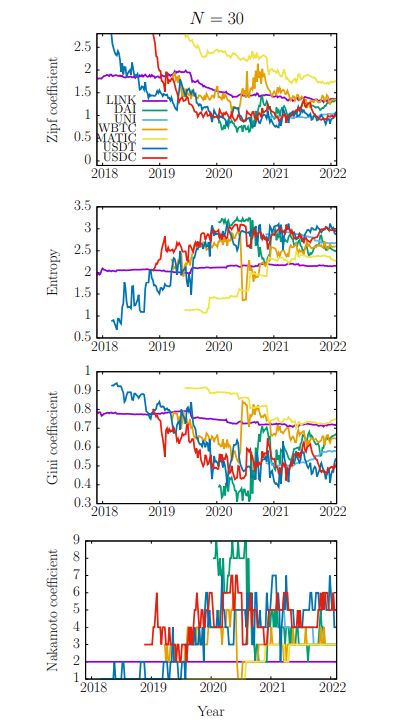
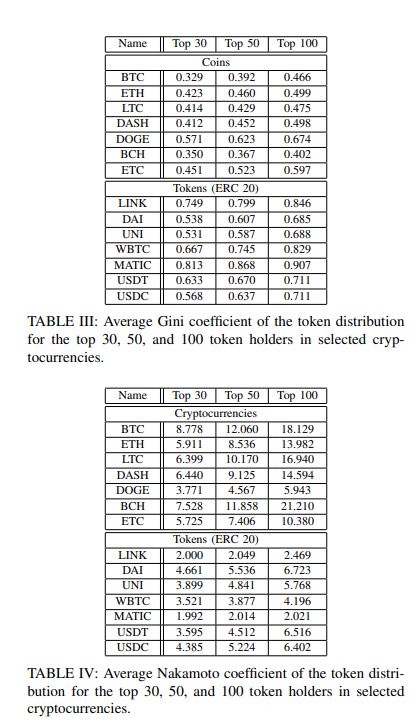
In this paper, we address the question of quantitative differences in the token distributions of coins and tokens. Tables IIV show that the analyzed statistical quantities for tokens and coins take different values. For example, the Zipf’s law coefficient of different coins, is for the most part, confined within the range of 0.4—1.25, while for ERC20 tokens, this range is 0.7—2.25 (see the top panel in Figs. 2-5). Furthermore, coins are typically less concentrated—the Gini coefficient is in the range 0.1—0.7, and the Nakamoto coefficient varies within 10—25 (for sample size N = 100). For tokens, the Gini coefficient is around 0.5—0.9, and the Nakamoto coefficient varies within 2-8 (N = 100). Nevertheless, it is worth stressing that the Gini coefficient for the ERC20 tokens has a declining tendency, and it might reach levels similar to coins at the same maturity level. One illustration of a tendency for the decreasing centralization are stablecoins[9] Tether and USD Coin. Both tokens start with extremely centralized token distribution as indicated by the Gini coefficient close to 1, but, as time passes, centralization significantly decreases.
Very low values of the Nakamoto coefficients of ERC20 tokens need to be taken into account while designing technological solutions. Especially if a given ERC20 token is an underlying Sybil protection mechanism of a DAO. Some parts of DAOs with a small Nakamoto coefficient could be paralyzed or even hijacked by attacking only a tiny number of nodes. To give a practical example: one popular feature in DAOs is a distributed Random Number Generator (dRNG). Some of the dRNG designs [18] are based on threshold signatures, where a random number is produced by the committee of nodes. If the collective signature is composed of partial signatures, weighted by the amount of held tokens, then a small Nakamoto coefficient might threaten the liveness of the dRNG. To address such a problem, DAO should adapt dRNG schemes where all of the partial signatures have the same weight or use a completely different dRNG scheme. For example, based on Verifiable Delay Functions (VDFs)[10].
[6] The ledgers of BCH and BTC split on August 1, 2017. The split date for ETC and ETH is July 20, 2016.
[7] The “Bitcoin pizza transaction” is a Bitcoin transfer made by Laszlo Hanyecz who spent 10,000 Bitcoins at a local pizza restaurant to buy two pizzas.
[8] See Ethereum address: 0x98c63b7b319dfbdf3d811530f2ab9dfe4983af9d
[9] Stablecoins are cryptocurrencies whose value is tied to a physical commodity like the US dollar, Euro, or gold.
[10] VDFs can only be computed sequentially and cannot benefit from parallel computation [14], [21]. Furthermore VDFs provide quickly verifiable proof of performed calculations.

